Current cash flow view
The Current page is the main page in Cash Management that allows you to review, analyze, and project financial transactions in a structured and personalized way. It provides insight into balances, actual cash flow, and projected cash flow in Cash Management.
The Current page includes options for reviewing balances and cash flow accounts, applying filters, adjusting views, and performing analyses.
Access the Current page
Navigate to  Cash flow > Current (default view).
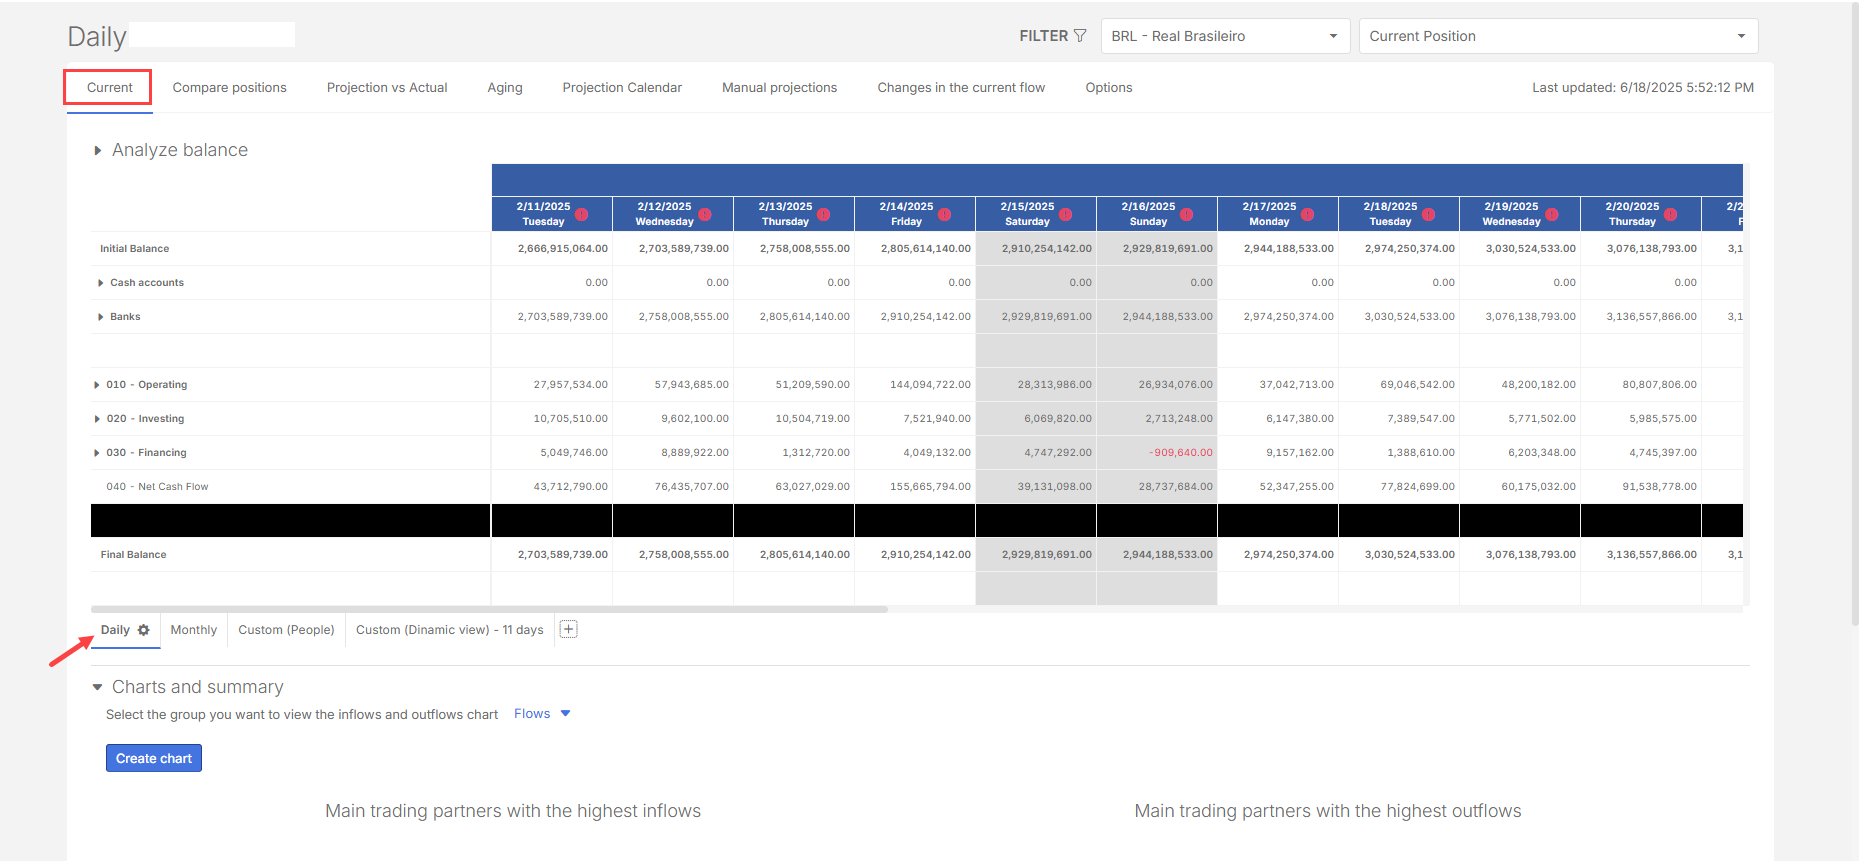
When you select the Cash flow menu, the system opens the Current page (default) with the Daily cash flow view. This view provides detailed cash flow information with filters to customize the view and a top menu offering analysis options such as position comparison, forecast versus actual, forecast calendar, and flow changes.
The cash flow table includes the beginning balance, treasury (cashiers and banks), accounts, and financial flows. Views can be set to daily, monthly, or customized. Graphical analyses can also be generated
Cash flow menu
In addition to the Current page, the Cash flow menu includes tabs that open the other main pages:
-
Current: The main view of the cash flow, showing daily, monthly, and customized data with graphical analysis.
-
Compare Positions: Allows comparison of two different cash flow positions on a single page, analyzing past, present, and future forecasts or changes.
-
Projection vs. Actual: Highlights differences or variations between projection and actual cash flow.
-
Aging: Provides analysis of overdue amounts, upcoming forecasts, and defaults in cash flow.
-
Projection Calendar: Enables manual forecasts, which are then included in the cash flow for the selected period.
-
Manual Projections: Lists all financial flows and compares integrated system data with entries made in the forecast calendar, allowing removal of duplicates and updates to information.
-
Cash Flow Changes: Displays all modifications to cash flow, such as due date adjustments or document re-classifications.
-
Options: Provides settings for cash flow, such as defining cash-generating flows and configuring the aging composition.
Cash flow filters
In Cash Flow, each page includes a filter that lets you adjust the analysis. System filter options include:
-
Consider contract values
-
Consider typed provisions
-
Hide zero-balance cash flow lines
-
Display original values of transferred documents
-
Display overdue line
-
Hide weekend and holiday columns
You can also apply filters by parameters such as entities, trading partners, document types, and treasury. For example, filters allow you to view the cash flow of one or more entities, groups of trading partners, or specific document types.
Current position/ List of positions
In the upper-right corner of the Cash Flow page, you can select the current position, which displays the latest cash flow status. You can also list and create snapshots of positions —saved views of cash flow at a specific point in time-stored for future analysis.
Analyze balance
Below the main Cash Flow menu is the Analyzing Balance option can be expanded or collapsed. When expanded, it displays the months of the current year (or the selected analysis period). You can drag the ribbon to choose the time range for viewing the cash flow.
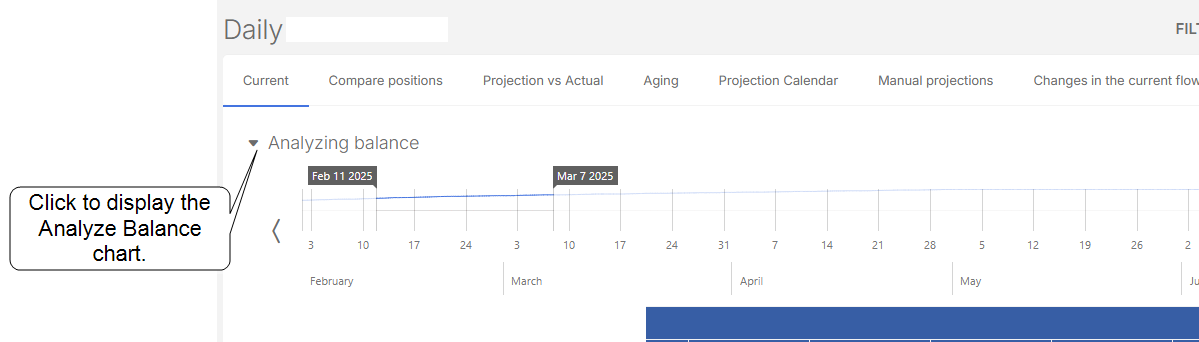
This function works as a date picker and also generates a graph showing the available balance margin for each selected period.
Daily cash flow
The cash flow table is organized by treasury structures and financial flows and contains different types of data:
-
Actual data: Information that has already occurred in the cash flow. These are documents settled up to the current position.
-
Projected data: Future information, including open documents not yet settled and projections without documents, typically created within Cash Flow.
-
Balances, Inflows, and Outflows: All financial inflows and outflows processed through banks or company cash registers, along with the final balance of each account.
The cash flow structure includes both the beginning balance and the ending balance, with details such as:
-
Treasury structure: Cash, bank, and investment accounts
-
Flow structure: Financial flows and accounting accounts
Cash flow balance calculations
Note: Inputs, outputs, and final balances must always be provided by the user.
The cash flow balance is calculated according to specific rules:
Beginning Balance: Reported only on the first date, and only when subsequent balances are generated from documents. When balances are imported (from bank or cash accounts), the system automatically calculates the beginning balance for each day.
Calculation Rules (Flow Extract):
Estimated balance
The estimated balance is calculated from imported cash flow projections, including future receipts and payments.
The cash flow is divided into three sections:
-
Actual: All financial transactions that have already occurred, including settled documents, balance information, and historical records.
-
Current Position: The present cash flow status. By default, this corresponds to the current day, but it can be configured to show a range of days forward (D+) or backward (D-) as needed.
Monthly cash flow
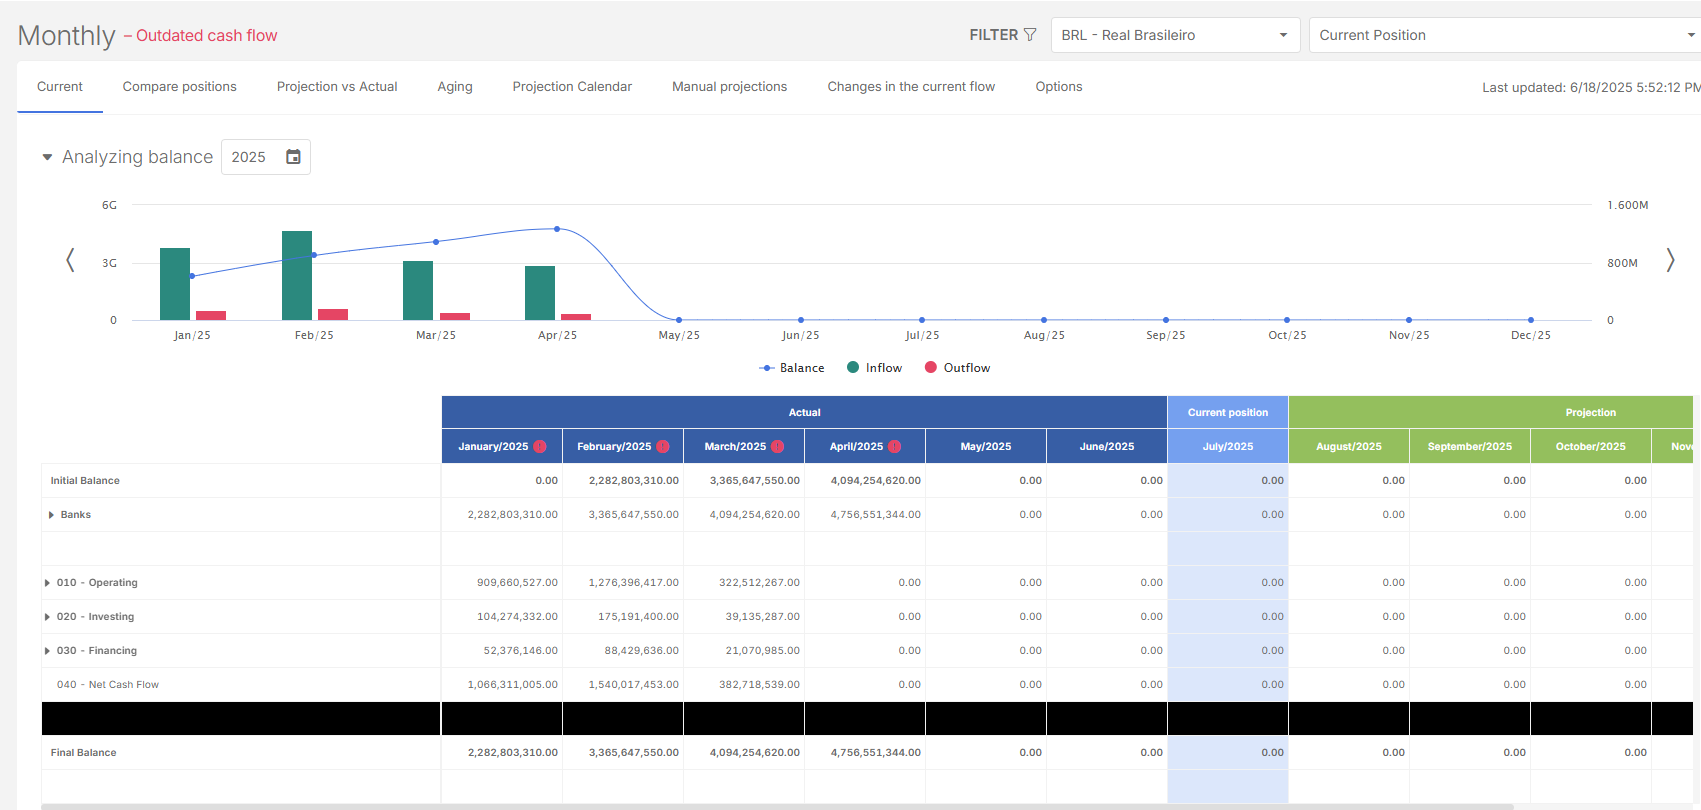
In addition to the Daily Cash Flow, the system provides a Monthly Cash Flow view.
This view allows users to analyze the company’s financial behavior with a monthly focus, making it easier to identify trends throughout the year.
Monthly analysis chart
At the top of the page, a bar graph displays:
-
The final balance of each month
-
Total monthly inflows and outflows
-
The 12 months of the selected year
The chart also functions as a navigation tool, allowing users to move between months for easier analysis and period selection.
Monthly flow structure
Below the chart, the Monthly Cash Flow table is displayed. It follows the same structure as the daily view but is organized into monthly columns. The table includes:
-
Actual: Amounts already settled up to the selected month
-
Current position: Balances and documents relating to the current point in the month
-
Projection: Future projections based on open documents
Additionally, the table presents:
-
Initial and final balances for each month
-
Bank and cash accounts (treasury structure)
-
Financial flows, allowing detailed analysis by category
The monthly view is designed for management analysis, financial planning, and monitoring goals throughout the year.
Custom cash flow
The Custom cash flow feature allows you to create personalized views of cash flow by adjusting parameters according to the analysis needs of the company or user.
Create a new custom flow
-
At the bottom of the cash flow chart, click
 . A configuration page opens.
 -
Enter a Name for the custom cash flow (for easier identification).
-
In Row structure, choose the line structure, deciding how the data will be organized (e.g., by financial classification, by business entities, etc.).
-
Select the Accrual basis format.
-
In Period Format, choose one of the following:
-
Abbreviated day name (e.g., Mon, Tue)
-
Full day name (e.g., Monday)
-
-
In the Column structure, click
 , and then, choose any of these options depending on the data type:
-
Projected: by days, fixed date, or within a range (from/to)
-
Settled and Late: by specific dates or periods
-
Other types: such as current position or fixed month
-
-
Choose any or both of the additional parameters:
-
Show overdue values in settled columns: Includes overdue documents that should have been completed but were not.
-
Don’t consider settled documents in the projected column: Excludes documents already settled but with future due dates.
-
-
Save your custom flow.
Charts and summary
At the bottom of the cash flow chart is the Charts and summary section. This feature provides visual representations of financial data to support analysis and decision-making.
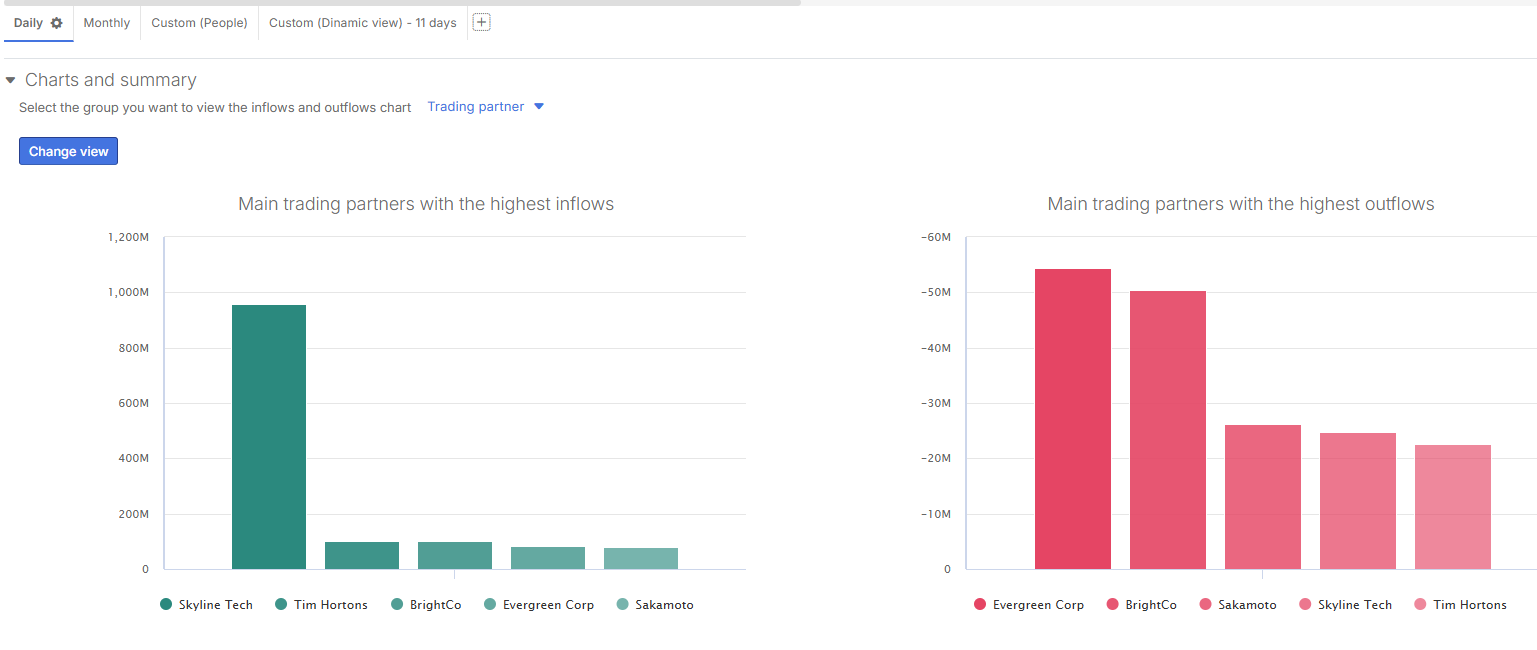
You can create custom charts from cash flow information for a more visual and comparative analysis of:
-
Inputs and outputs
-
Financial classifications, or trading partners
Chart Types
The following chart types are available:
-
Bar
-
Column
-
Pie
These charts help identify trends such as which financial classifications generate the most inflows or outflows, or which trading partners are most involved in the transactions.
Viewing limit
For clarity, each chart displays a maximum of 9 financial classifications or trading partners.
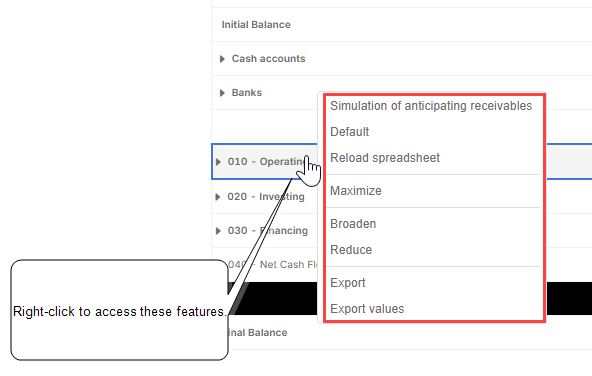
Right-click (advanced) options
Some features in the application are only available through a right-click on specific items or areas. These context-specific actions are not visible in the main interface but are essential for accessing certain tools or performing advanced tasks.
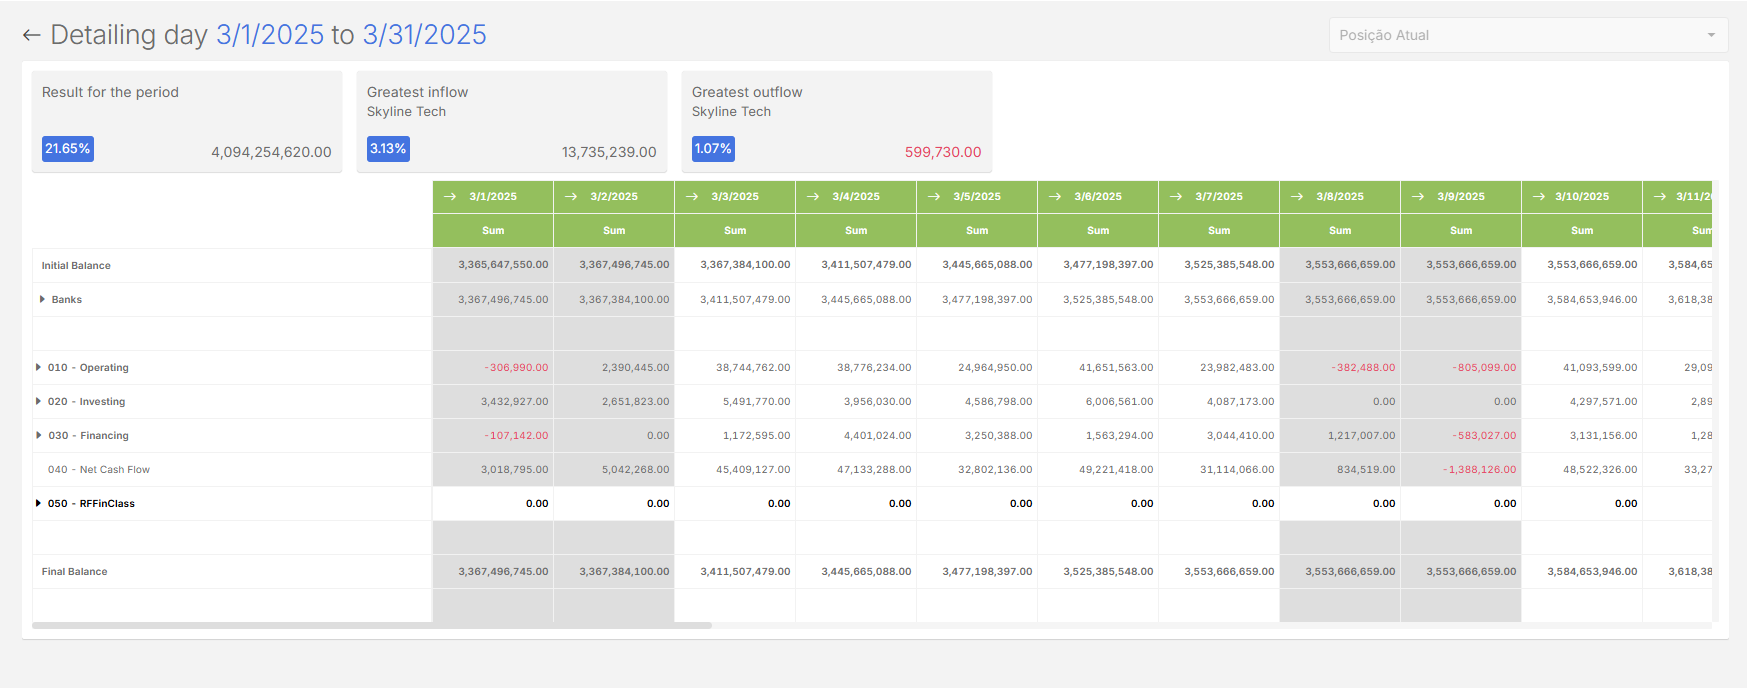
Detail day (daily cash flow breakdown)
In the Daily Cash Flow view, you can click on a specific day in the column and select the Detail day option.
This feature provides a detailed analysis of cash flow for that single day. The detail view displays:
-
Cash flow exclusively for the selected day
-
The final balance for the day (result of the period)
-
The largest inflow of the day
-
The largest outflow of the day
Detail month (monthly cash flow breakdown)
Just like the Detail Day option in the Daily Cash Flow view, the Monthly Cash Flow includes a Detail Month option.
When selected, the system opens a detail view with full information for the chosen month, including:
-
The result of the period (final balance of the month)
-
The largest inflow of the month
-
The largest outflow of the month
-
The complete cash flow structure, organized by day
For example, selecting December displays the daily cash flow from December 1 to December 31, including:
-
Daily movements of each financial flow
-
The accumulated balance day by day
-
A complete breakdown of inflows and outflows within the month
This view supports in-depth analysis of financial performance across the month while maintaining daily-level detail.
Detail classification (breakdown by financial flow)
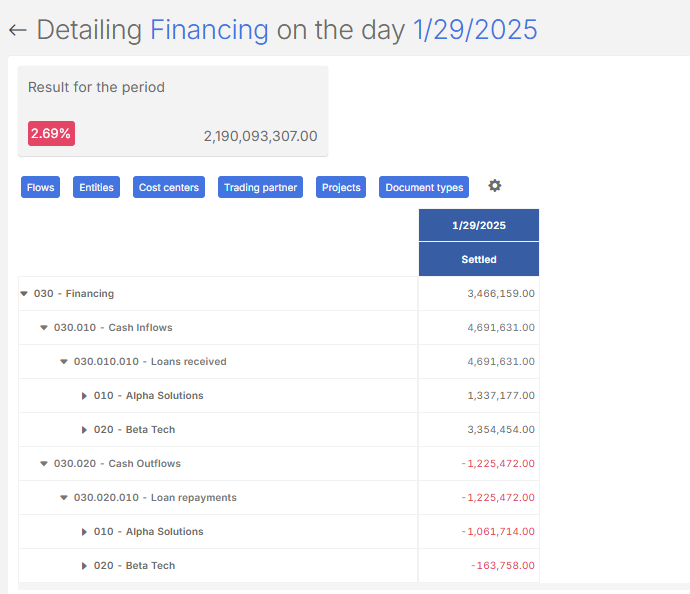
When selecting a row for a financial flow, you can use the Detail classification option.
When activated, the system displays the cash flow filtered by the selected flow, showing only its respective values.
On the detail page, data is presented in card format, including:
-
Result for the period: Final balance of the flow in the selected period
-
Largest inflow of the period (if the flow is inflow)
-
Largest outflow of the period (if the flow is outflow)
Show documents
In the financial flow lines, you can select one or more accounts and use the Show Documents option.
This function acts as an audit trail, displaying the documents that make up the amount shown on the selected line and date in the cash flow.
When selected, the Show Documents option opens a page with details of the documents linked to that financial flow, highlighting which items contribute to the value presented in the cash flow.
Receivables anticipation simulation
The Receivables anticipation simulation feature allows you to simulate security advances directly in the system and analyze their impact on cash flow.
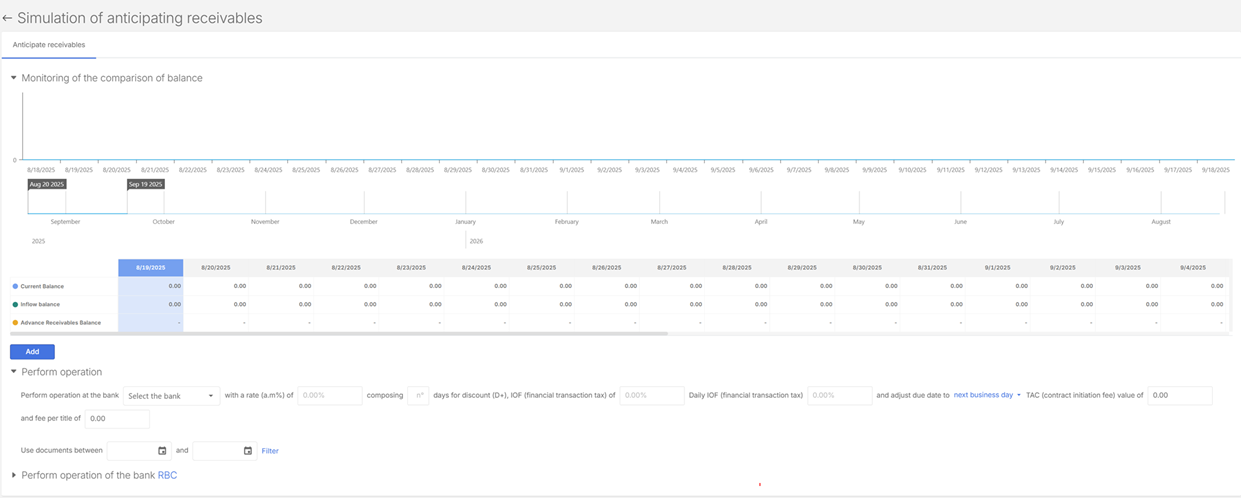
Choosing Receivables anticipation simulation in the right-click options opens a dedicated simulation page showing:
-
Comparative balance chart – differences between the original and simulated flow.
-
Period selector – graphical display of balance variations.
-
Balance table – current balance, total entries, and balances from simulated advances.
-
option – create and configure new simulations
Run a simulation
To set up a simulation, fill in the following fields:
-
Bank – institution responsible for the advance.
-
Monthly rate – interest rate applied.
-
Number of compositions – specify installments.
-
Days for discount (advance) – number of days considered.
-
IOF (Tax on Financial Transactions) – daily and total values.
-
Due date adjustment – choose next business day or same day.
-
Credit opening fee – charged by the bank.
-
Fee per paid title – additional charge per document.
-
Days to consider – defines which documents are available for simulation.
After filling in the data, the system displays all available documents in the Simulated Documents section, along with a results table,
Simulate anticipation
-
Select one or more documents.
-
Click Simulate.
-
The system calculates:
-
Discount amount applied
-
Net credit value
-
Applicable taxes and fees (IOF and others)
-
The graphs update automatically, comparing the original balance with the post-simulation balance.
Review simulation history
At the bottom of the page, the system records a history of simulated documents, allowing you to monitor and track past simulations.
Default
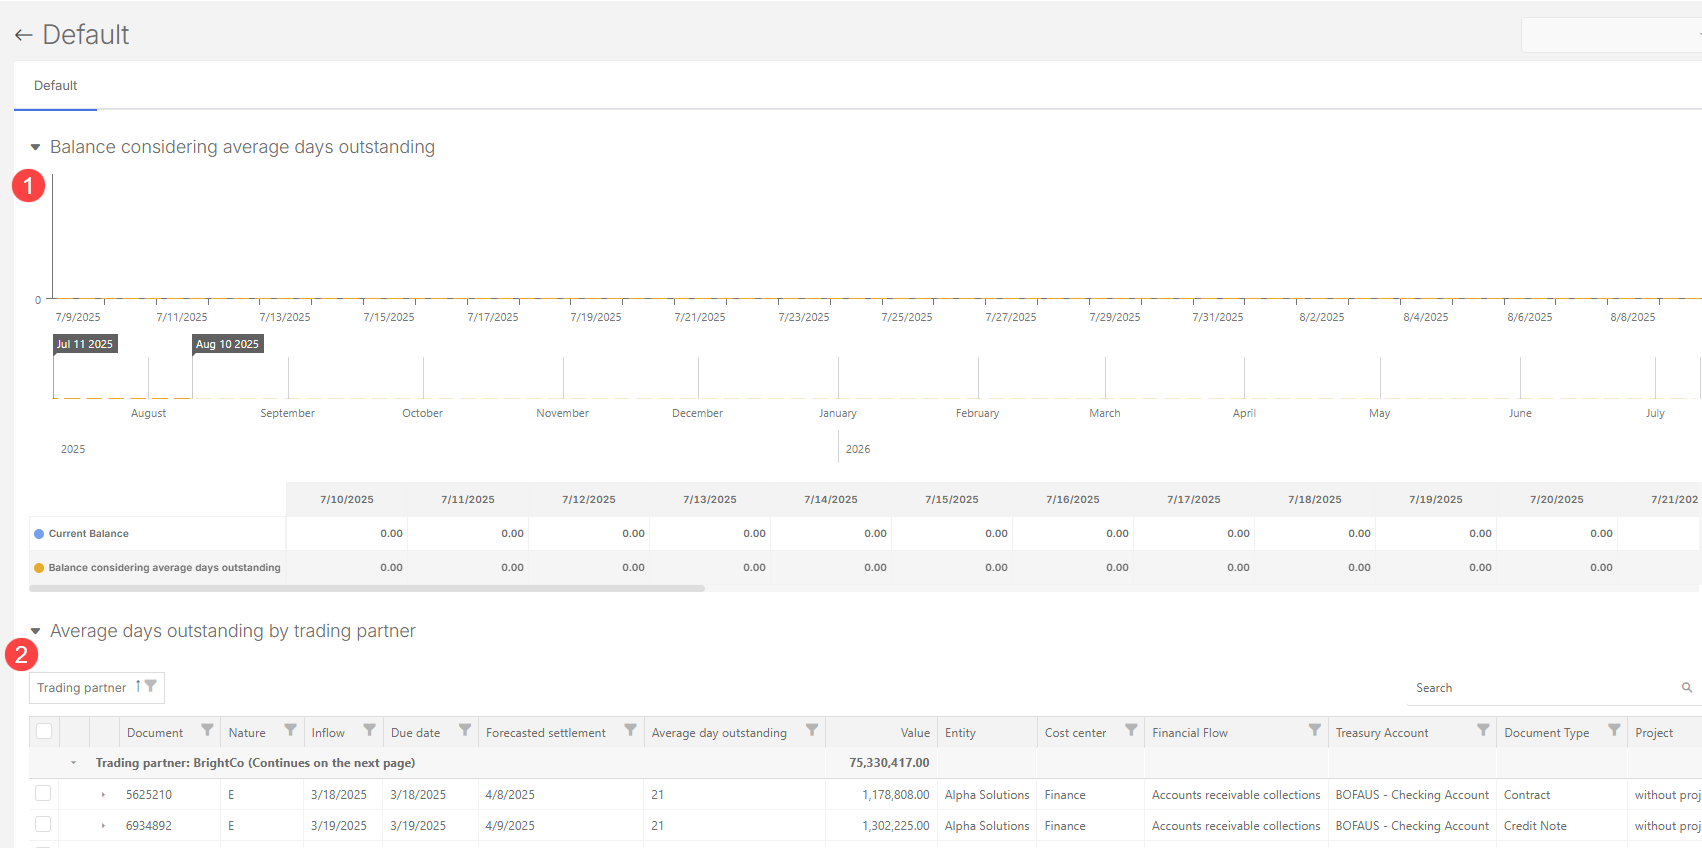
When selecting the Default option, the system displays two views:
-
Balance Comparison with Delinquency: Compares the current cash flow balance with the balance excluding overdue and unpaid documents. This helps analyze the impact of delinquency on the company’s financial health.
-
Default Tracking by Trading partner: Lists all individuals (such as customers or suppliers) with defaulted documents, enabling more detailed analysis. From this page, you can:
-
View overdue documents by trading partner
-
Apply filters by date, value, or status
-
Export data to spreadsheets for monitoring and collection actions
-
More advanced options in the cash flow table
The hidden right-click menu in Cash Flow table provides several options to help with navigation, analysis, and exporting data.
Available options include:
-
Reload Spreadsheet
Refreshes the cash flow table in real time, ensuring you are always viewing the most up-to-date information.
-
Maximize
Expands the cash flow to full screen, optimizing the available viewing space.
-
Zoom In
Increases the zoom level of the table, making the data easier to read.
-
Zoom Out
Restores the table to its original size by removing the applied zoom.
-
Export
Generates an Excel file with the same structure and data currently displayed on the screen (cash flow statement format).
-
Export Values
Provides a more flexible export option. You can:
-
Select a specific date range.
-
Choose which fields and parameters to include.
The system then generates an Excel file exactly in the format you defined.
-