Projection vs Actual
The Projection vs Actual page allows you to compare projected cash flow with actual results.
Presented in a weekly view, this page supports analysis of expected inflows and outflows versus actual movements, making it easy to evaluate differences between financial planning and execution.
Access Projection vs Actual
Navigate to  Cash flow > Projection vs Actual.
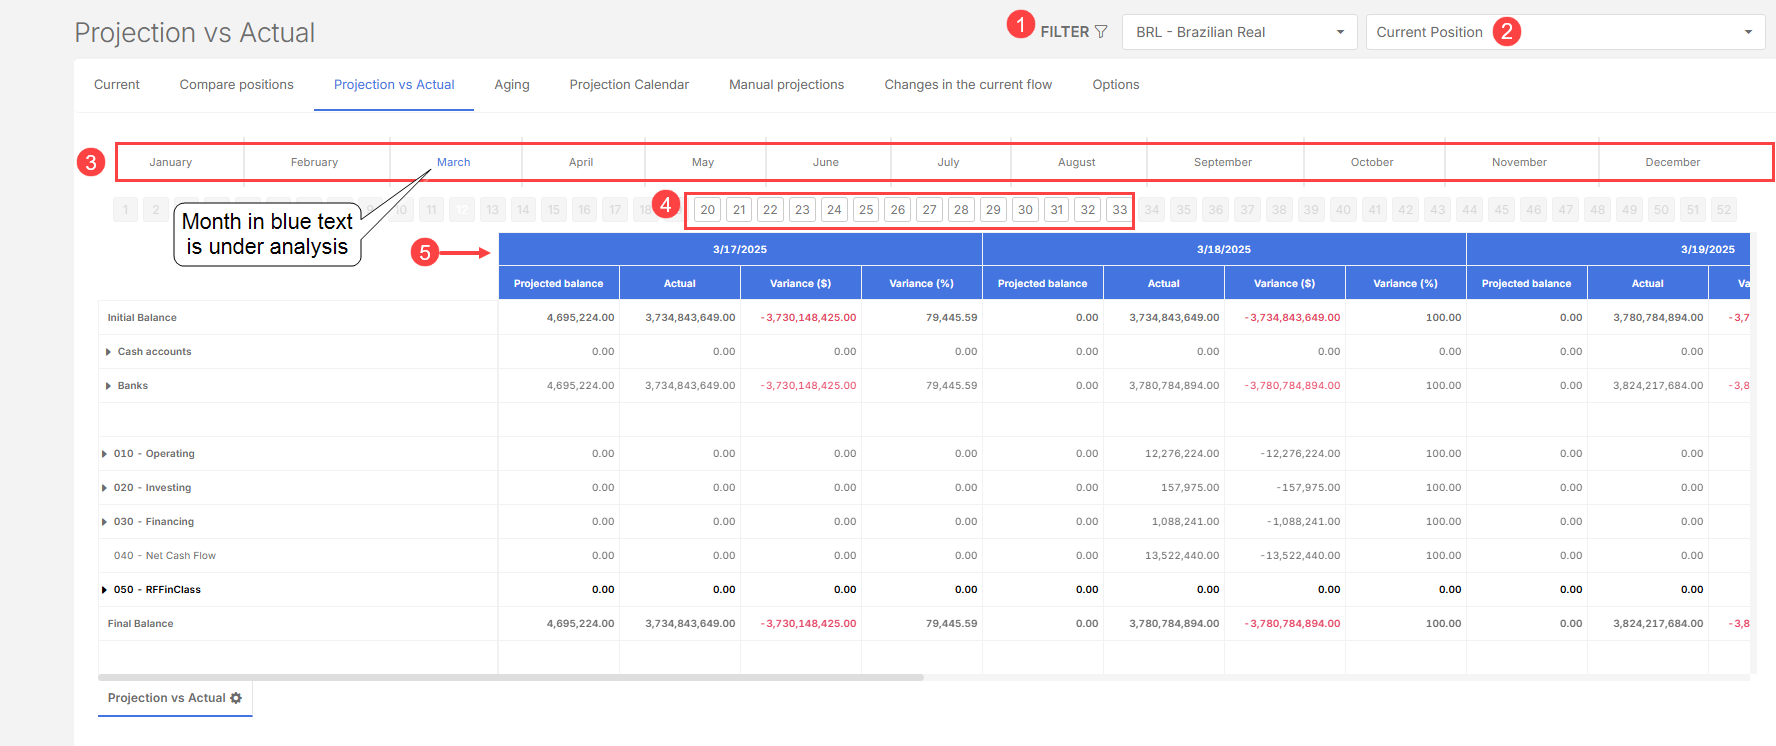
The Projection vs Actual page includes:
-
General system filters

-
Position selection (current position or saved positions)

-
Monthly chart to identify the period under analysis

-
Week selection showing up to 13 active weeks (depending on the time of year)

-
Weekly cash flow table with:

-
Initial Balance
-
Banks and ATMs
-
Financial Classifications
-
Final Balance
-
Column structure
The table is organized by week, and each week displays:
-
Name or dates of the days included
-
Indicators for each item:
-
Projected
-
Real Variation (R$)
-
Percentage Change (%)
-
This structure allows quick identification of deviations between projections and actual results.
Right-click options
The Projection vs Actual page also offers advanced features:
-
Show documents – view the titles that make up the displayed values
-
Detailed classification – analyze a financial classification separately
-
Reload spreadsheet – update data in real time
-
Maximize screen – view in full screen
-
Zoom in/out – adjust table scale
-
Export – generate an Excel spreadsheet of the displayed data
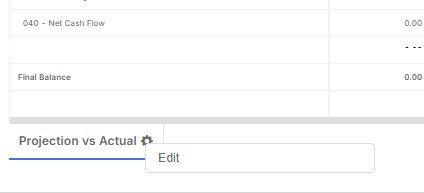
Customize the view
-
On the lower left side of the page, right-click on the view name.
-
Click Edit to customize the page.
-
You can now make the following edits:
-
Rearrange the order of structures by dragging columns around
-
Remove columns such as percentage change, variation, or actual values by dragging them to the field below.
-
-
Save your view.