Use your dashboard
Dashboards provide users with a dynamic, interactive view of their cash flow, bank balances, and related financial indicators. It provides a consolidated, real-time view of financial transactions at both monthly and daily levels. It enables precise monitoring of inflows, outflows, bank balances, and cash flow to support risk anticipation, enhance financial planning, and strengthen strategic decision-making.
The Cash Management Dashboards module is a powerful tool for operational financial control, offering:
-
Real-time monitoring of balances and transactions
-
Flexible customization and filtering
-
Multi-currency support
-
Easy report export
Access the Dashboards
Navigate to  Dashboards.
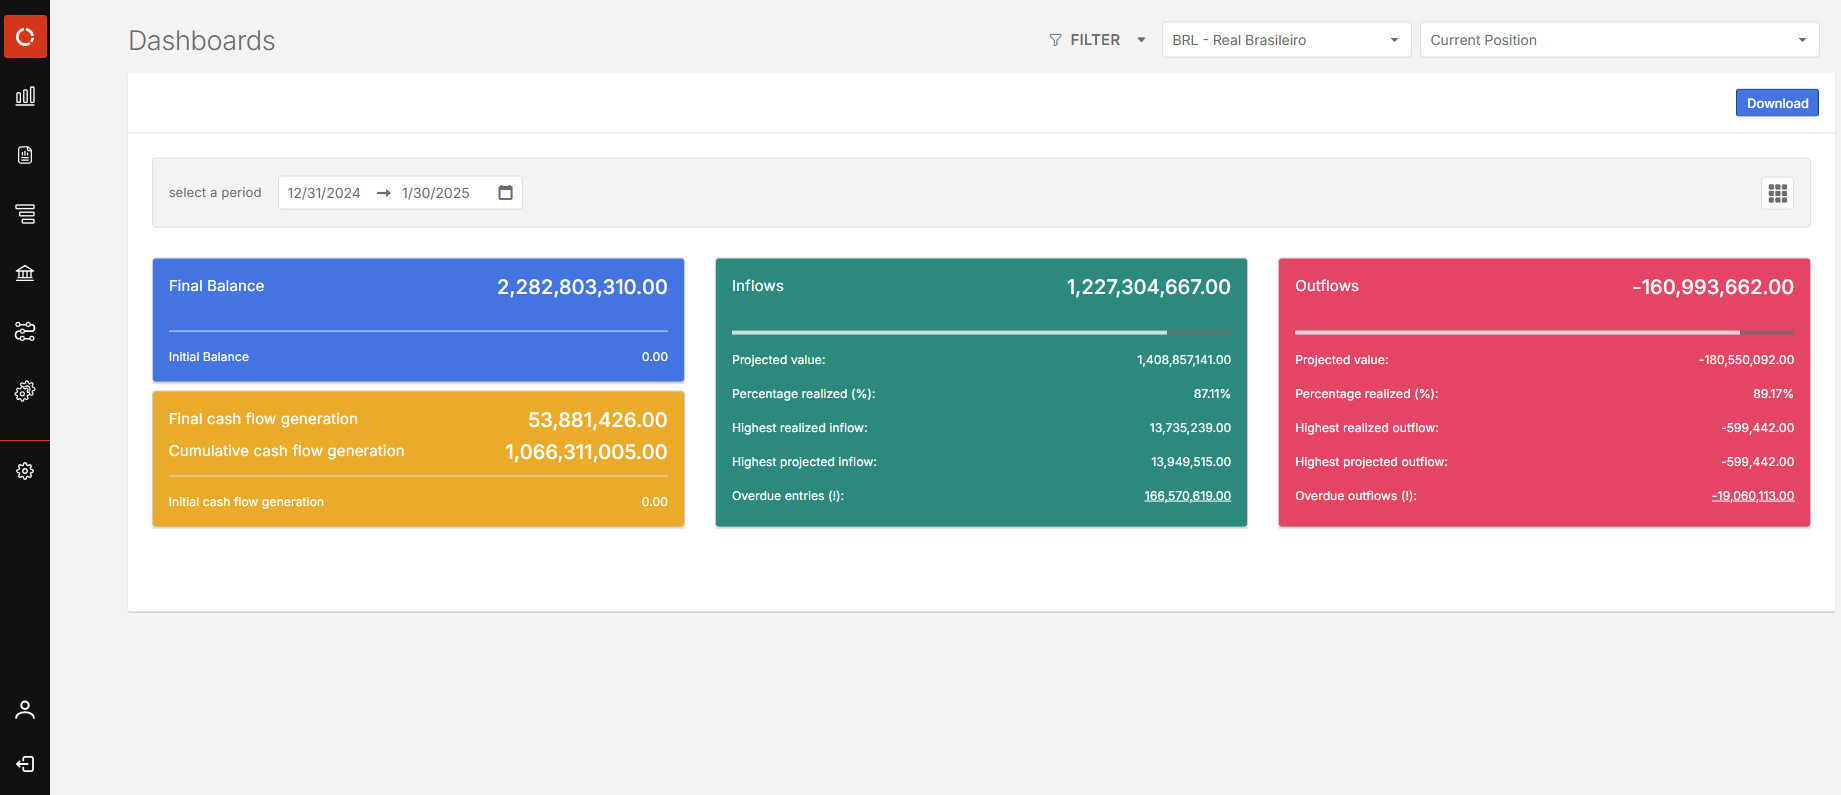
Upon accessing the Dashboard, it:
-
Shows the projected inflows /outflows, the percentage realized, and the amounts not yet realized.
-
Displays any unpaid or unreceived items, helping users identify gaps in expected cash flow.
Users can click on charts and graphs to drill down into specific data points. Additionally, data can be explored in greater depth by hovering over or interacting with dashboard elements.
Purpose of the dashboards
The dashboards are designed to:
-
Analyze performance using input, output, projection, and cash generation indicators.
-
Control daily financial flow by entity or cost center for agile operational monitoring.
-
Track the evolution of final cash balances to identify critical periods.
-
View real-time bank balances, highlighting positive or negative account positions.
-
Compare actual results with projections to adjust planning based on trends or deviations.
Main graphs
-
Monthly Cash Flow – Displays inflows, outflows, projections, and cash generation for each month.
-
Daily Cash Flow – Shows daily financial transactions segmented by entity or project.
-
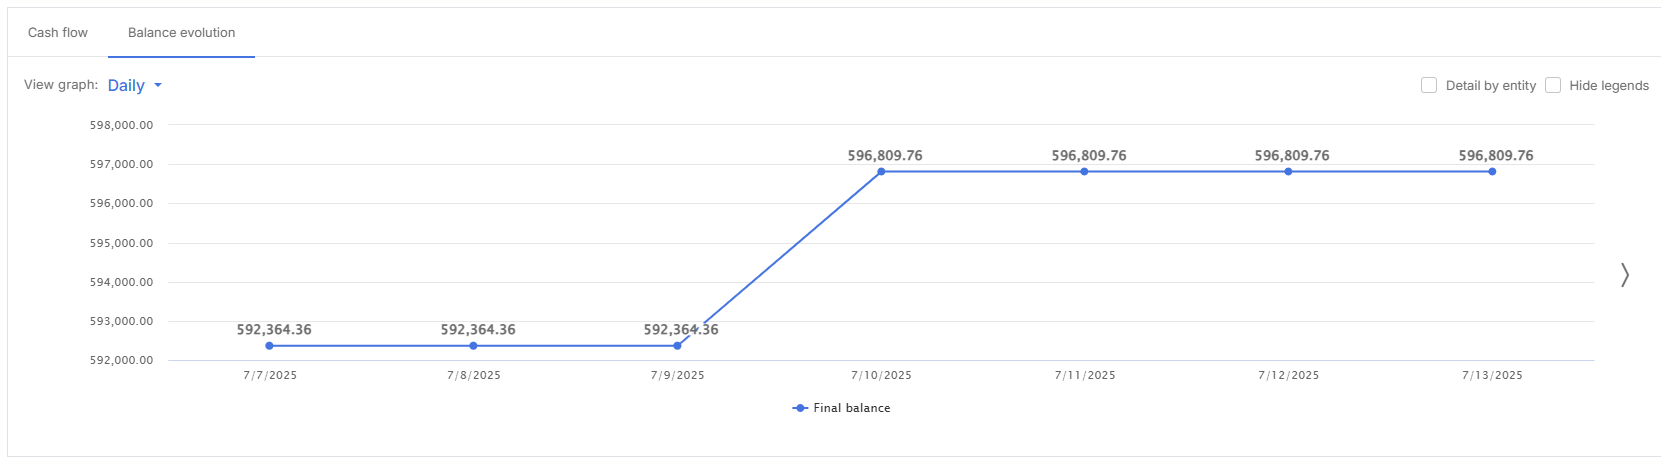
Balance Evolution – Tracks final daily balances based on entries and exits to identify critical or stable periods.
-
Evolution of Financial Flows – Details movements for accurate daily and monthly analysis.
Analysis period
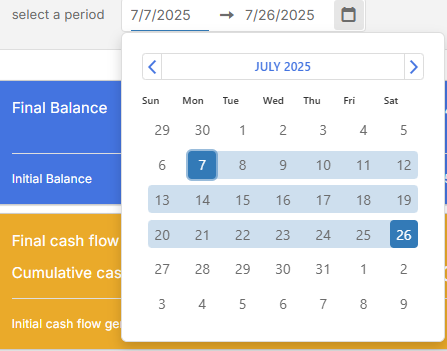
Select any date range for seasonal analysis, comparisons, and projections.
For example, switching from one month (e.g., July) to another (e.g., August) will refresh all charts and balances accordingly.
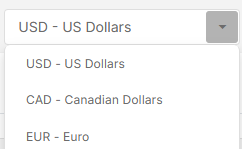
Currency selection
Select a currency to display data in USD, EUR, or CAD. This feature is essential for companies with multi-currency operations.
Filters
Refine data by entity, cost center, trading partner, project, document type, treasury account, and financial classification.
Additional features include:
-
Consider contract/forecast values
-
Hide zero-value lines
-
Display transferred documents
-
Display overdue items
-
Select balances by company or bank
For more information on using filters, refer to the Filters article.
Position
In the top right corner is the Position drop-down box containing Positions which are the different snapshots of the cash flow that the user has created. Currently, each user can create up to seven (7) positions.
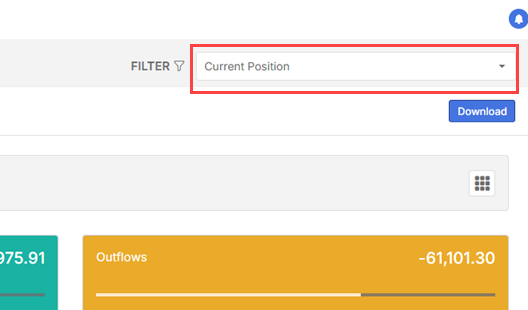
When you select a previously created Position, you are essentially analyzing your past cash flow, because that position is frozen—it doesn't change over time or reflect any new updates.
Note: Positions can be used in almost all modules, not just in dashboards.
Add a position
Creating a position, saves the current state of your cash flow to compare it with future versions. It allows you to track how your projections evolve over time.
-
In the Position drop-drop-down box, select Position list. The list of positions is displayed.
-
Click
 .
. -
Select an End date and enter a Name for the position.
-
Click
 .
.
Remove a position
-
In the Position drop-drop-down box, select Position list. The list of positions is displayed.
-
Select the positions you want to delete.
-
Click
 .
.
Customize your dashboard view
Using the dashboard menu grid,  , users can choose which sections to display and view.
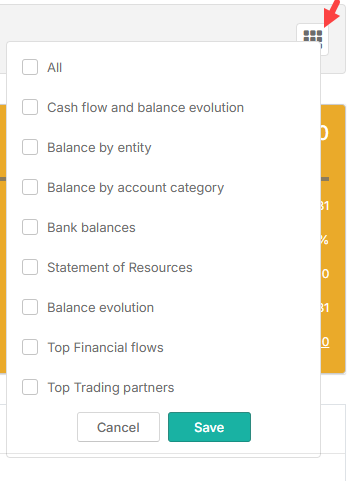
Cash flow and balance evolution
Shows financial inflows/outflows over time and the evolution of balances.
Example: Identify if the company generates positive daily or monthly cash flow or periods of liquidity surplus/deficit.
Balance by entity
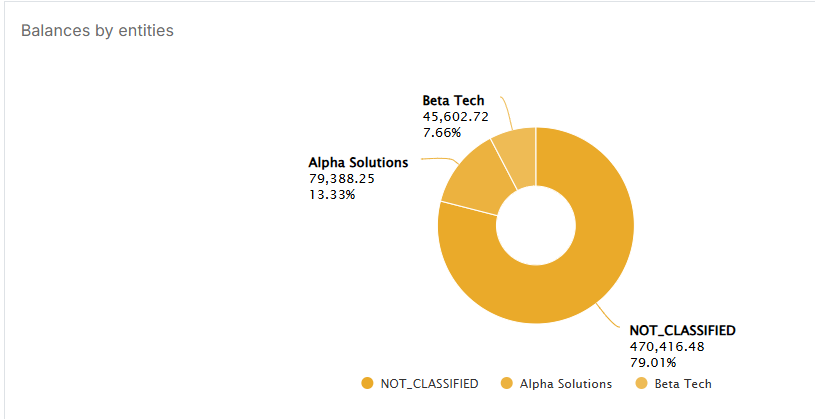
Displays balances by business entity, branch, or department.
Example: Compare head office versus branch performance in different cities.
Balance by account category
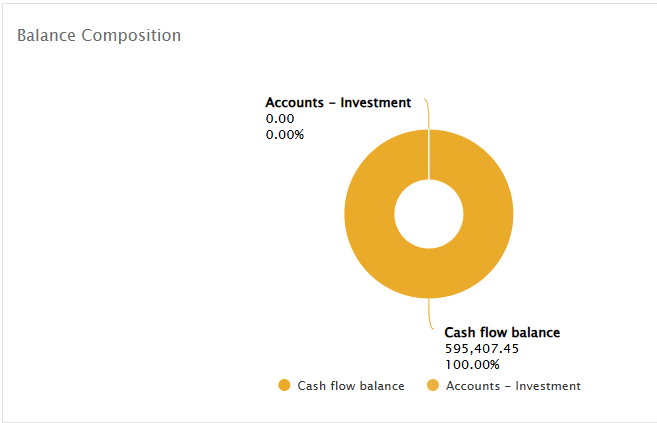
Shows balances by account type (operating, investment, provision).
Example: See funds available in investment accounts versus checking accounts.
Statement of resources
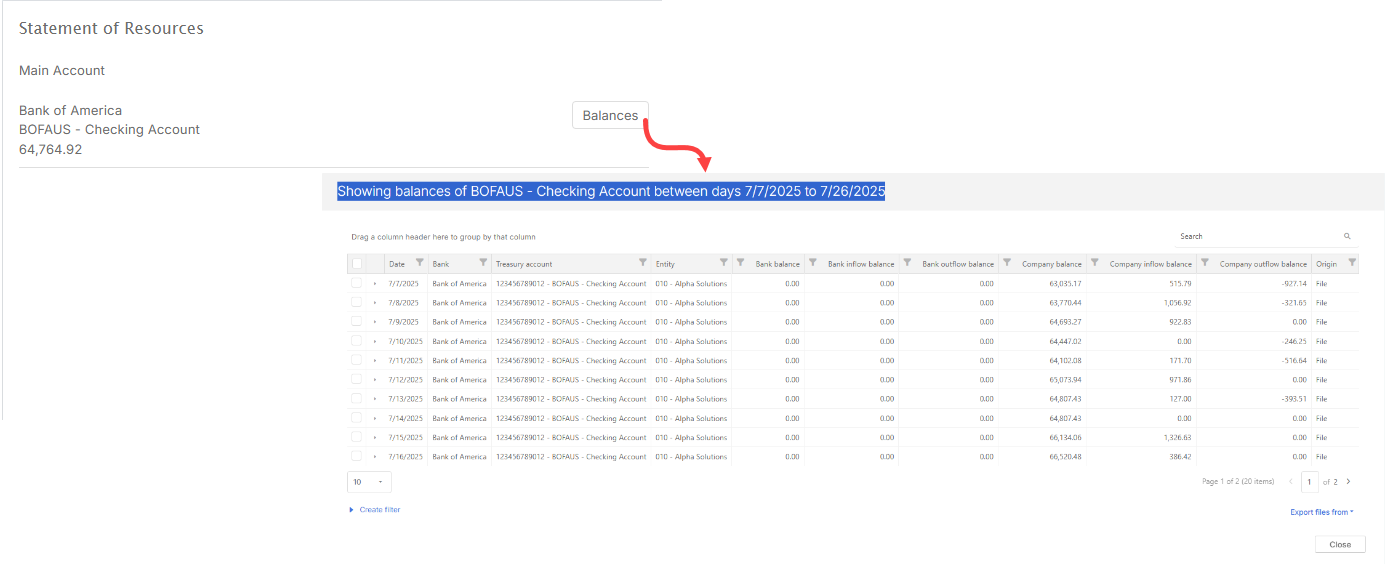
The Statement of Resources provides a clear summary of the financial resources currently available. It shows the balance of the main account and identifies any other bank accounts that are in a negative position. This gives users quick insight into possible cash-related issues.
Purpose
This functionality helps users understand their overall financial status at a glance. By showing both the main account balance and any negative balances in other banks, it supports faster decision-making and more effective cash management.
Bank balances
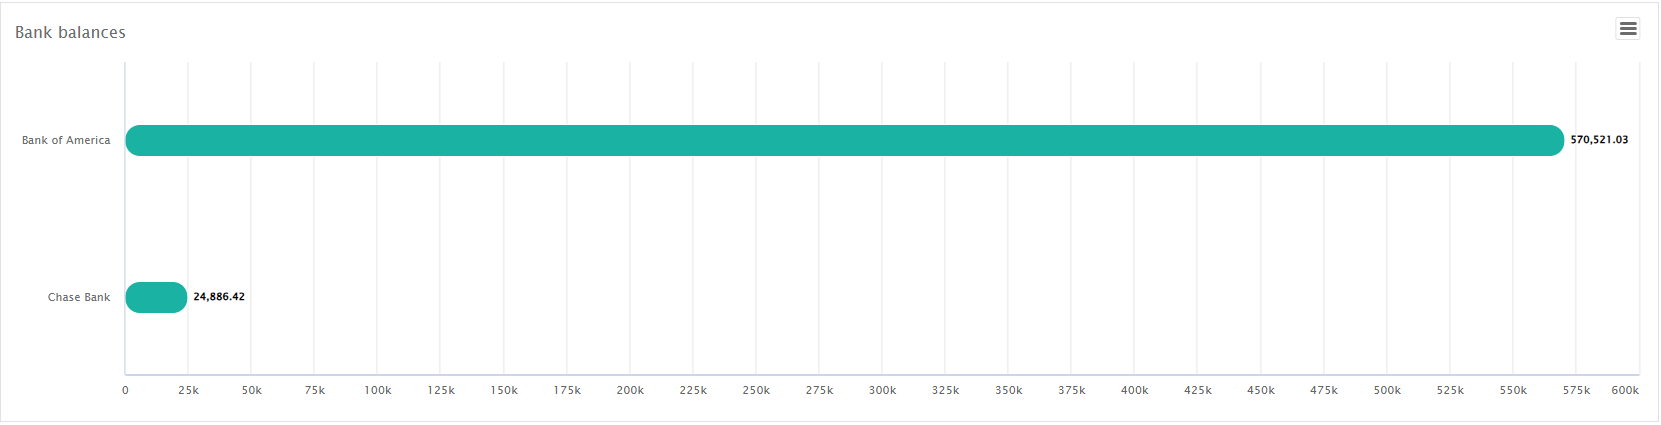
Displays the updated balance of each bank account linked to the system.
Example: Monitor accounts with positive or negative balances.
Balance evolution
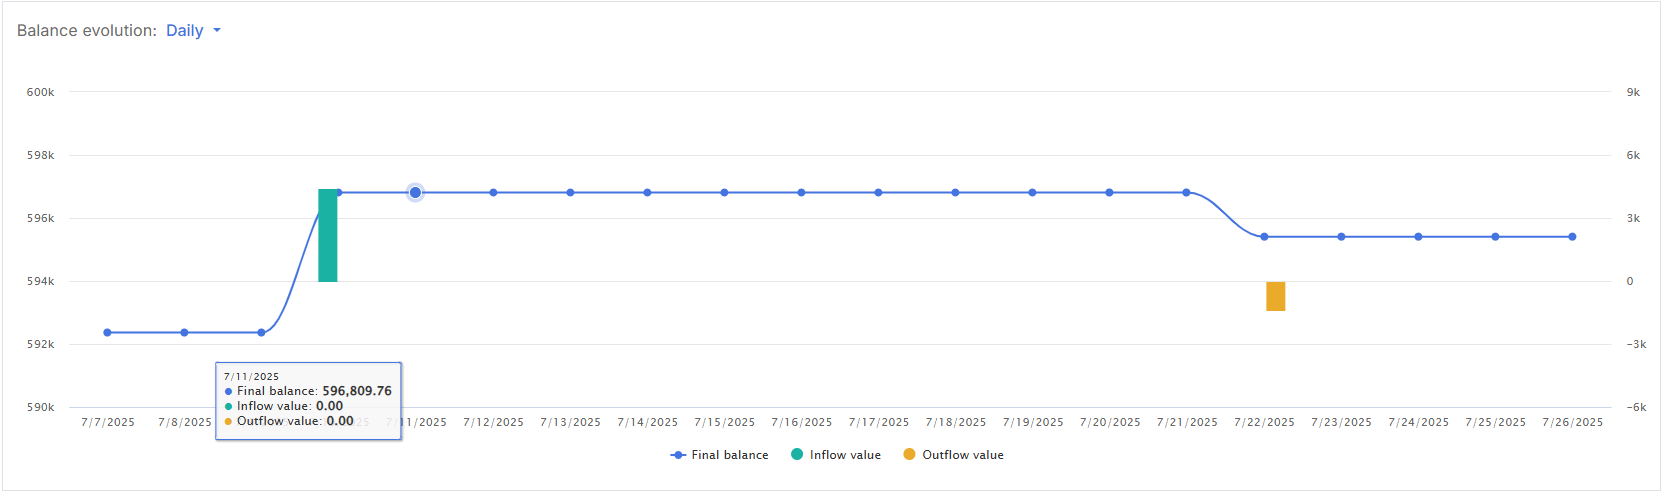
Graphically presents cash balance changes over a selected period (daily, weekly, or monthly).
Example: Identify the exact day of peak or lowest cash position.
Top financial flows
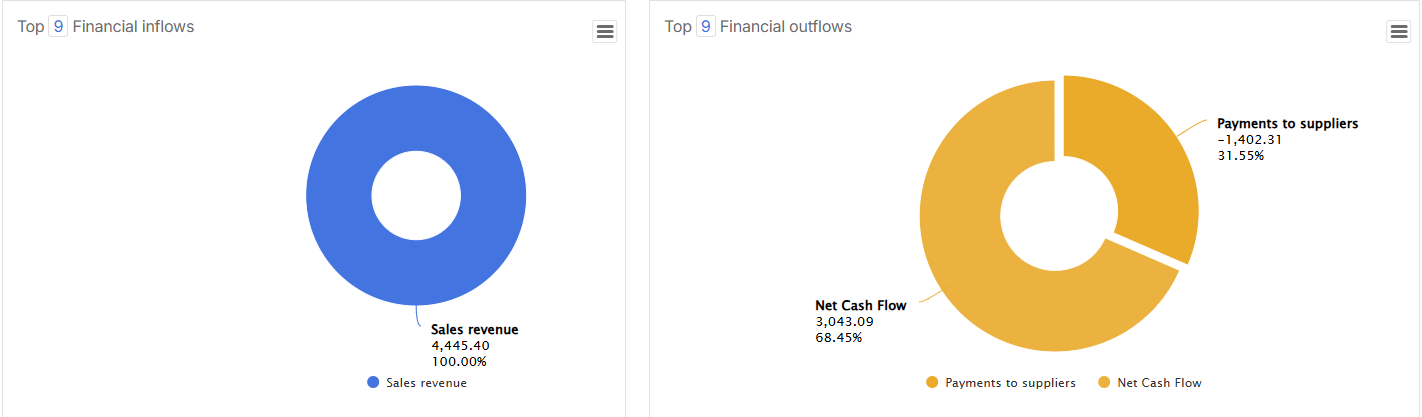
Lists categories with the highest transaction volumes.
Top trading partners
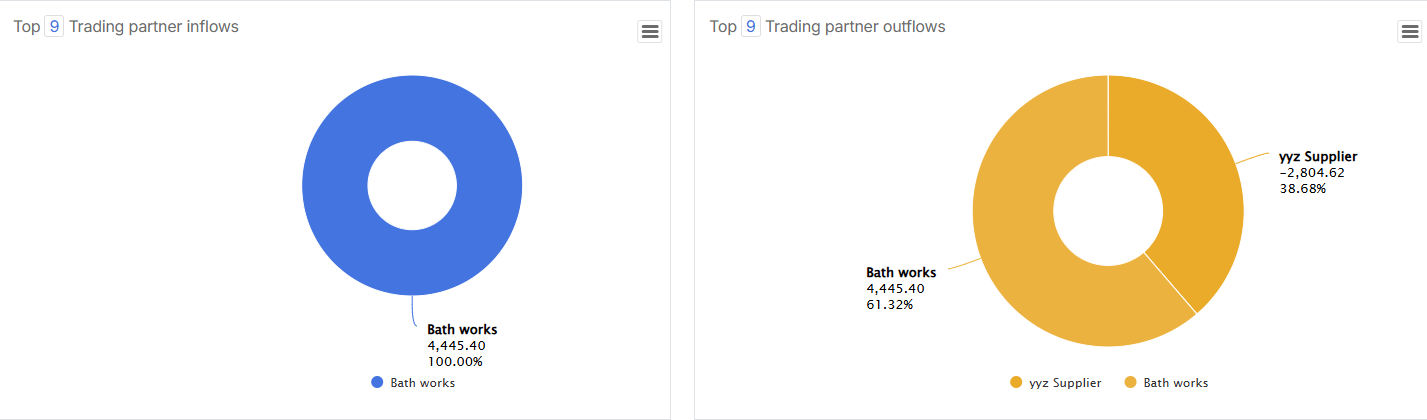
Identifies trading partners or entities with the largest transactions.
Example: Determine which supplier received the most payments.
Data export
Data export – Click  to export filtered reports to PDF for archiving and presentations.